
Analytics Graphs
The transmission of knowledge is undoubtedly important, but if we can analyze the learning progress of students, it would undoubtedly assist educators in lesson preparation. The Analytics Graphs Module provides multiple reports for teachers to review the participation and learning outcomes of students in each class.

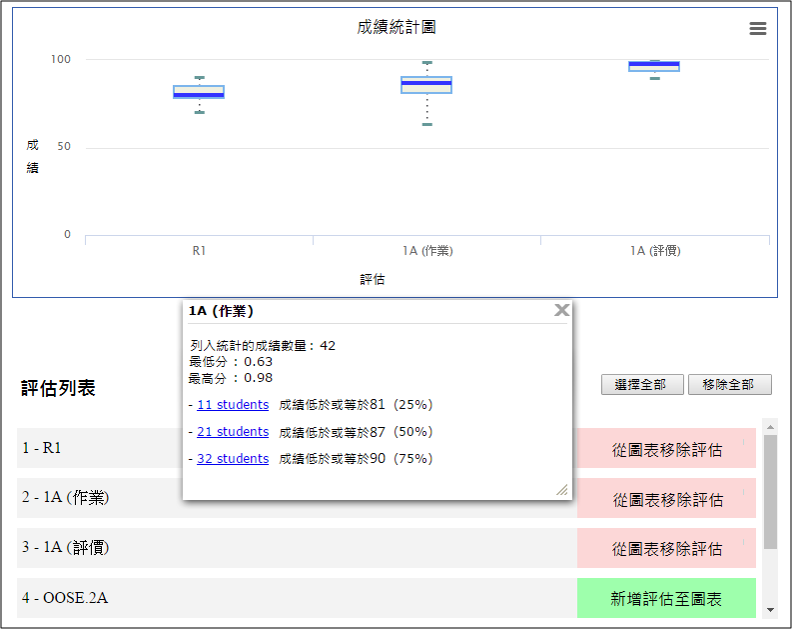
Grades chart
The Grades Chart provides statistics on student assignments and test scores, including minimum, maximum, and average grades.
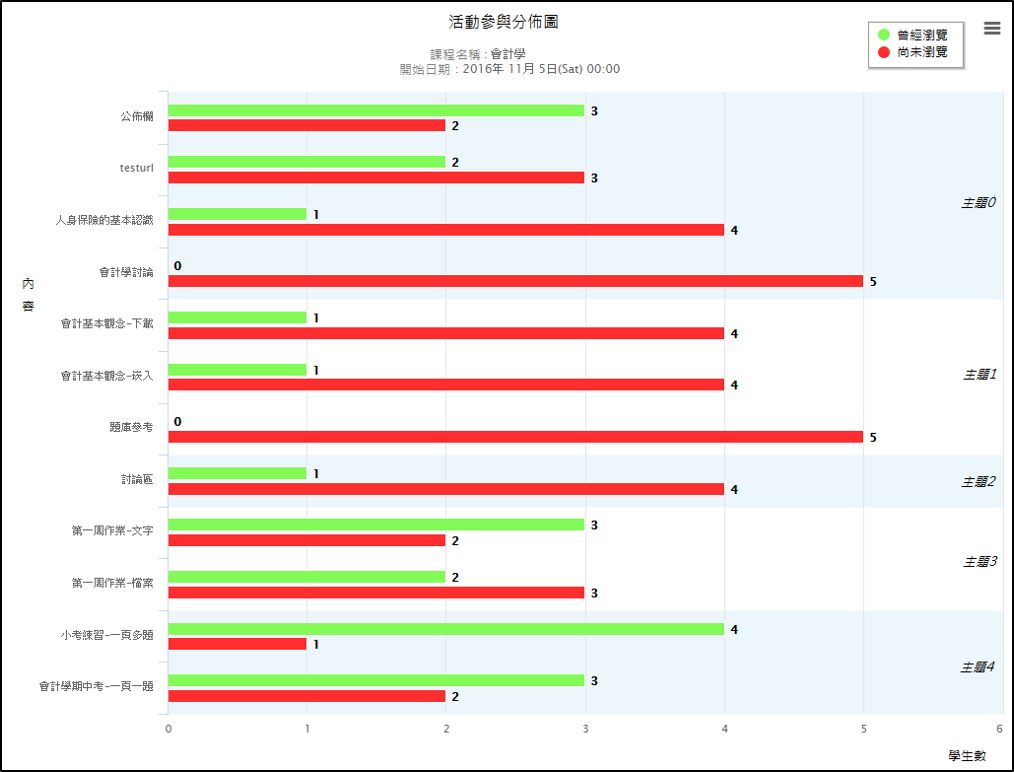
Content accesses
This feature calculates the number of students who have accessed and who have not yet accessed each resource.
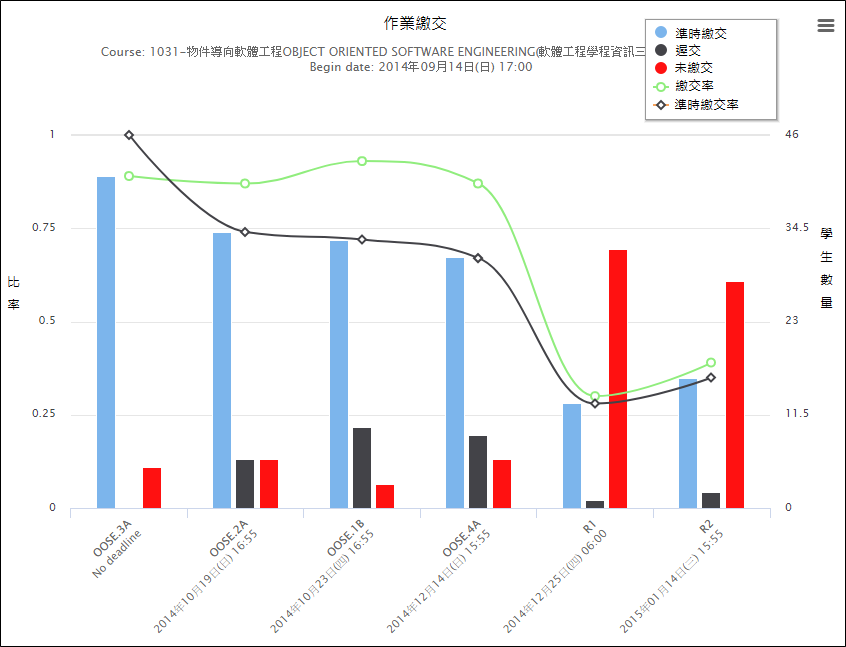
Assignment submissions
This feature calculates the number of students who have submitted assignments, submission rate, and on-time submission rate for assignment activities.
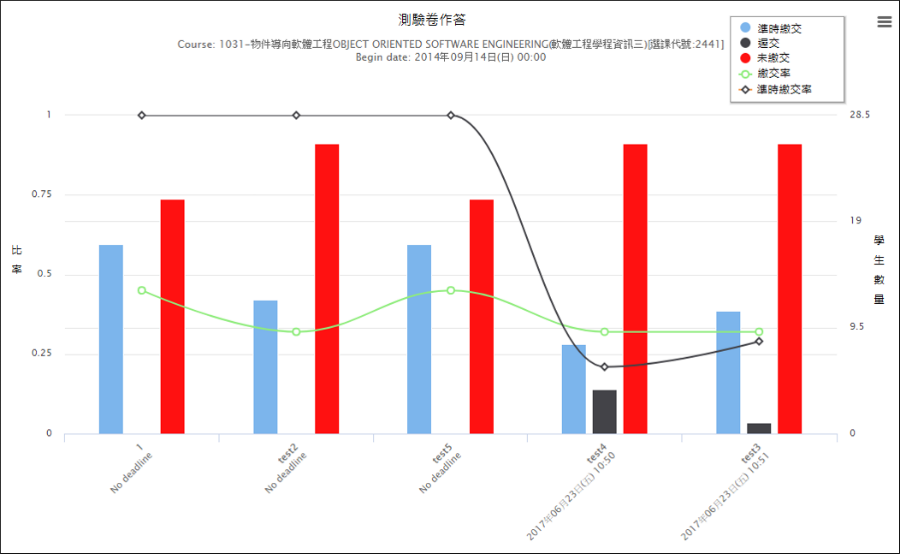
Quiz submissions
This feature calculates the number of students who have answered quiz questions, answer rate, and on-time answer rate for quiz activities.